Migrating our Legacy Apps to Windows Containers

Where it began

In the past five years, there’s been a big shift towards microservices and containers in the technology space. Microservices allow us to decouple domain knowledge between services, keeping them simple which increases velocity at which we are able to place software in customers hands. Being able to deliver software fast helps us respond to changes as well as get features out that benefit our customers.

Containers play a vital role in dependency management and act as a packaging mechanism for bundling software into portable processes.

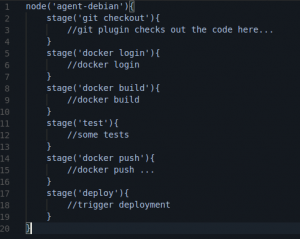
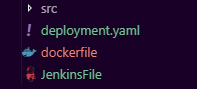
Ever since we’ve moved to containers our philosophy evolved around keeping it simple. Therefore every microservice git repository has a folder for source code, a JenkinsFile for CI/CD, a dockerfile that describes the dependencies of our software and a deployment YAML file that describes the services infrastructure as code. Therefore keeping source repositories very simple

Keep source code simple

Kubernetes

Kubernetes at Webjet is our go-to orchestration platform for running distributed systems, allowing our engineering teams to become way more efficient in delivering and running software. Kubernetes also allow us to pass ownership of production services to self-organised development teams, making teams self sufficient. As we build out more features for our system, we would add them is loosely coupled services instead of adding more code to our legacy code base. You may read about our monolith to microservices journey in the link below:

At Webjet, we run everything on Kubernetes…

Well not everything…

Yet!

We’ve written about our story “Monolith to Microservices” which dives into our journey of breaking down our legacy application into microservices using containers and Kubernetes. For many companies, it’s not always possible to completely decouple the entire legacy system into microservices.

Our approach was to target low hanging fruit, moving parts that are easy to move that have low impact to the over all system if something went wrong. Another approach was to make a decision whereby we would not tact on new features to the legacy system, but instead build out new services for new features. These new services would go into Kubernetes. By following these two principles, we were able to shrink our legacy system over time.

The legacy system still plays an essential role in our business and it would not be of value to invest more development time in further decoupling and rewrite unless new features come up that allow us to prioritise and do so.

As the legacy system shrinks in size, it’s stability over time also improves since no big changes are being made to its code base. Our microservices journey has taught us a lot about the benefits of container and container orchestration systems. Was there a way we could overlap the benefits of containers and Kubernetes with our legacy system ?

Windows Containers

At Webjet our move to container based software has had a number of benefits which resulted in faster delivery, reliable software and productive engineering teams. Moving our legacy application to containers would allow us to inherit all those benefits allowing us to deploy our legacy system more frequently. The health probe and self healing features of Kubernetes will allow us to add a great degree of stability to the legacy system. More-so containers scale well especially when scheduled using Kubernetes it allows us to run a legacy process per CPU core. Using horizontal and vertical autoscalers would allow us to scale the system down during off peak and ramp up during peak times. With the current infrastructure, it’s not a simple task to scale up our system.

To get the benefits of containers and Kubernetes, is where Windows containers come in. The aim was that we could shift the code base to Windows containers with minimal or no changes to code.

Challenges & Highlights

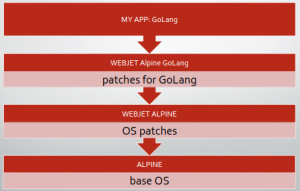
Moving our codebase into a Windows container was fairly straight forward. Microsoft provides a base container image on Docker Hub, with the latest Windows Server 2019

FROM mcr.microsoft.com/dotnet/framework/wcf:4.8-windowsservercore-ltsc2019

This base layer already has IIS web services installed, so it’s just a matter of adding our compiled code to it.

Our first and most obvious obstacle was that we knew we needed a Kubernetes cluster capable of scheduling windows containers. Luckily, since we’re running in Azure, Microsoft announced General Availability of Windows node pools for Azure Kubernetes Service.

This means we can run Windows Server Core 2019 nodes in our existing cluster with relative ease:

az aks nodepool add \
--cluster-name $CLUSTER_NAME \
--name="windows-server" \
-g $RESOURCE_GROUP \
--node-count=2 \
--os-type Windows

Once deployed, we can see Linux and Windows machines running side by side:

Windows and Linux side-by-side

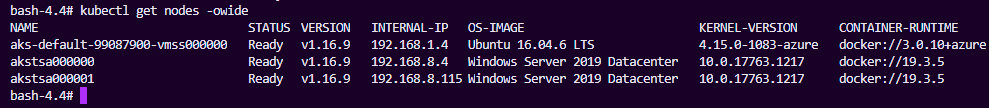
We are able to schedule windows containers using the same deployment specs we use for microservices. When writing a deployment spec, its important to use node selectors to ensure your Windows services run on Windows machines only, by adding a node selector:

nodeSelector: "beta.kubernetes.io/os": windows

What about our database ?

It’s very important that our legacy application has access to its database. The legacy system needed to run on the same Azure Virtual Network as the database to ensure reliable connectivity and low latency.

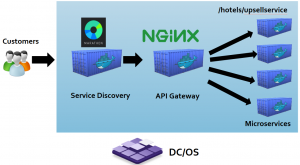
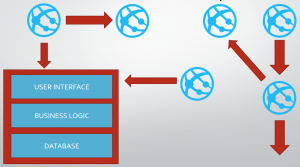
To achieve this, we followed a two step process. Firstly, containers in Kubernetes run on isolated container networks per machine as illustrated below.

basic container network

By default, containers on one machine cannot talk to containers on another machine. Kubernetes solves this with kube-proxy

container-to-container networking

The challenge is that kube-proxy is designed using Linux iptable features provided by the kernel, which are not available in the Windows operating system. In order to get containers to be able to talk between machines, we use the Azure Container Network Interface plugin (Azure CNI). This plugin allows all containers in Kubernetes to get an IP Address from the Azure Virtual Network IPAM tooling

Azure Container Networking

This means our containers can now talk freely between Azure Virtual Machines as well as other Azure services on the Virtual Network since they get an Azure private IP address on the Azure network. This is essential for networking to function as well as our legacy system to be able to talk to its database. The next challenge was to see how we would bridge the Kubernetes Virtual Network with our existing database network in Azure.

Virtual Network Peering

Azure networking allows engineers to seamlessly peer Virtual Network subnets to one another using a feature called VNET peering. This allows us to connect our Kubernetes network to our database network. The two peered networks would communicate with one another over Microsoft’s private network:

Virtual Network Peering

There are two points to note here. 1) Is to ensure you allocate enough IP addresses in your Kubernetes subnet and configure Azure CNI to allow for more IP addresses to be available to containers in Kubernetes. The default number of IP addresses available is set to 30, which we increased to 110.

2) Thereafter we also had to ensure there was no subnet overlap between the two peered networks to allow peering to succeed. Peering networks in Azure is only possible if all network subnets have unique ranges that do not overlap.

Time Zone & Culture Settings

For our legacy system to work without significant code changes, we need the timezone of the server set to Australian time. Firstly all Azure VM’s part of the Kubernetes cluster runs in UTC time zone. This is the default and a good practice for servers to maintain. However, our legacy system relies on Australian time zone and since it’s quite a large complex codebase, there would be a significant effort required to change and test the impacts of running in UTC time.

The challenge is that windows containers cannot run in a separate timezone to the host. The “Set-TimeZone” command that triggers a system call to the host operating system is blocked in windows containers and triggers an Access Denied error. In Docker it’s considered best practice for containers not to manipulate the host operating system. However since Windows container runtime does not offer the ability to run containers on a separate time zone, we had to come up with a solution.

To workaround this problem, we’ve built a daemonset that is a specialized pod that runs on each node in the cluster. When the pod starts up on a existing or new node, it’s sole purpose is to perform an SSH command to its host and set the timezone. The daemonset gets its host IP address from the Kubernetes downwards api. Using SSH allows us to perform the command on the host, without a system call through the container runtime..

Set-Timezone DaemonSet

Logging and Monitoring

In Docker, the best practice for writing logs is to send them to stdout by default. This ensures the container runtime can gather logs of each container on the host. If the container throws an error and terminates, the container runtime would have the logs for that crash on the host. This helps us achieve centralised logging with log extraction services like Fluentd.

There are two problems at a glance. Firstly windows services do not always write their logs to stdout. Our system writes all its logs to Event Viewer in Windows. The second problem was even if our application was writing to stdout, The IIS process that would run as process 1 inside the container does not write its child application process logs to stdout either.

In order to get all Event Viewer logs out to stdout, Microsoft have built a Windows container tool set on GitHub, with the purpose of improving Windows container experience to align some of the missing bits that Windows containers have in the eco-system. “LogMonitor.exe” helped us get all our Event logs to stdout so the logs could be extracted out of the container to achieve centralised logging.

Performance and Stability

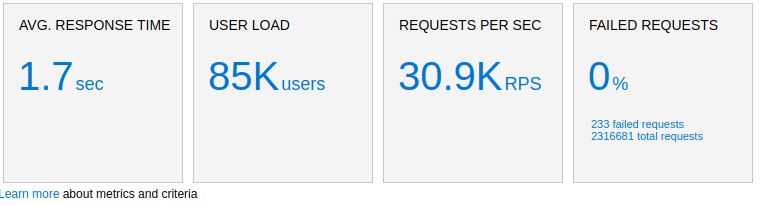
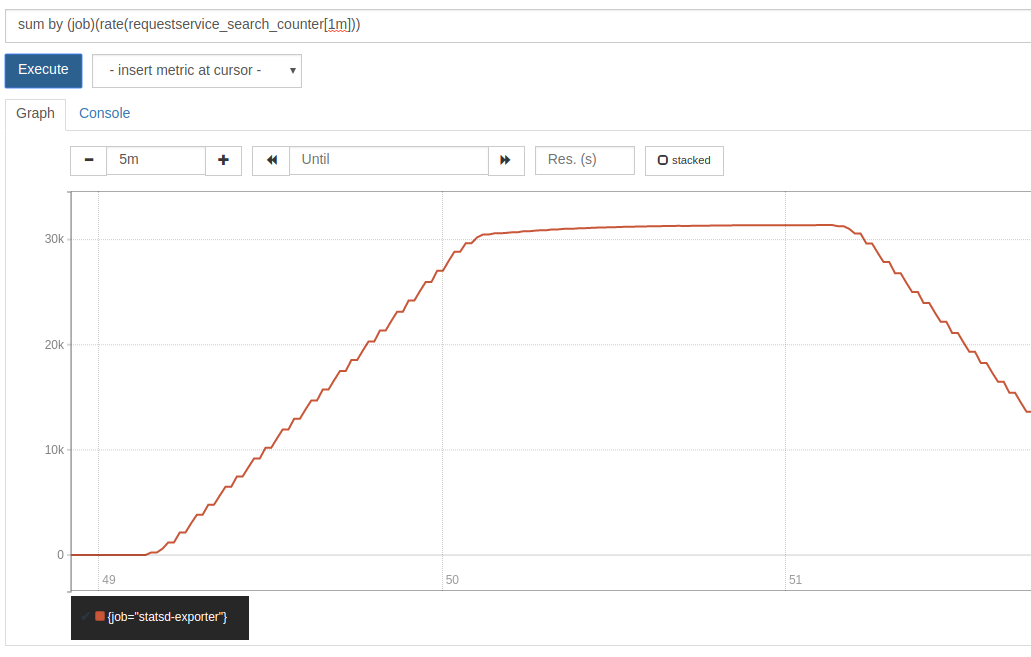
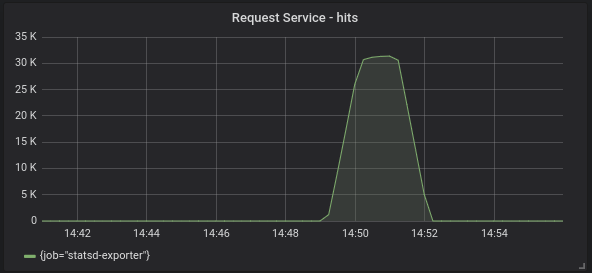
The final test for us was to ensure the system is stable over time. To test this out we’ve built up a simple performance test that would perform constant flight searches on the stack using a utility called WRK.

We schedule a number of “wrk” containers as pods on Kubernetes running inside the cluster with a simple pod spec

wrk – an HTTP Bench marking tool

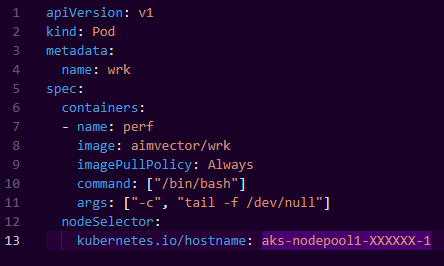
We can ramp up traffic by adding more wrk pods, and leave this running for a couple of days to look out for things like the process health, system health, memory leaks and any unforeseen stability issues that may arise.

So far our testing in terms of performance and stability is on par with the current legacy infrastructure. The process has been pretty seamless and smooth helping us to transition to a container based infrastructure quite soon.

What’s Next?

Next up, we will be shifting our focus to the existing CI/CD pipeline for our legacy application. There are a couple of challenges remaining:

  • Since our container image can only build on Windows Server Core 2019, How do we build the container image in our existing build server ?
  • Configuration and Secrets – Since our legacy system relies heavily on a transformation process to inject secrets and configuration files per environment, What would this look like in the Kubernetes world ? Kubernetes provides the ConfigMap and Secret API which does not currently align with our methods of deployment configuration and secrets for the legacy system. Our engineering teams will come up with a strategy to evolve this process to be container native.

These are exciting times ahead, and if you are interested to see more on these CI/CD developments and other activities in the platform engineering space, stay tuned to our tech blog.

Building a scalable StatsD metrics system

Building a microservice platform that is scalable and can handle hundreds and thousands of requests per second is a difficult task even on modern cloud platforms.

There are many challenges in building modern distributed system and monitoring these systems can be particularly tricky. In this post, I’d like to do a deep dive into how we designed a metrics platform that is able to scale, aggregate and feed in to a monitoring solution to support reporting on anything in the system that a developer or operator wants to track.

As our engineers at Webjet build out our distributed services over a global landscape, our recent goal has been to scale these systems linearly so we are able to achieve 30,000 requests per second with latency as low as 2 seconds for each request.

There are several challenges with designing this type of platform.  We have had to tackle many of them so far, including:

  1. Handling high volume of incoming requests and more importantly how to handle socket connections on the platforms edge
  2. Fanning out connections from the edge to different microservices within the platform. Managing more socket connections!
  3. Fanning out connections from internal services to external providers from whom we get hotel content from. Handling outbound connections
  4. Caching
  5. Contention in network
  6. Dealing with high CPU tasks
  7. More importantly and for this post: How do we track each individual request and report on it without adding massive contention to the system.  And do this within a reasonable cost!

Our Starting Point

Our starting point was using StatsD.  StatsD is a powerful stats aggregation service that got our attention because it’s very simple to deploy and operate. There are many client libraries so it works across multiple platforms.

StatsD is able to track counters, timers and gauges. Counters are important for us to monitor throughput of each microservice, i.e.  Requests per Second. Timers are important to track how much time incoming requests, internal and external requests take to complete.

To operate at a very large transaction volumes, we will need a scalable a metrics system. The first problem we faced with our StatsD server was that it became overloaded because it is a single threaded NodeJS server and aggregation on this server was CPU bound, so metrics were dropped.

Our first intentions were to scale the StatsD server, however when you run multiple instances of StatsD, your aggregation will split among these instances and your metrics will become skewed. Folks at Anomaly wrote a great post about three ways to scale StatsD.

To summarise that post, the StatsD community have built a cluster proxy to overcome the scaling issues by using clever hashrings to ensure metrics go to the same StatsD backend and are aggregated correctly. This proxy however becomes the new bottleneck so to overcome this you can run a few of these proxies by running one on each host as described in the Anomaly blog post.

A service would make a call to the StatsD proxy on the same host which would pass on the metric to an external host running a StatsD server.

HOST { [Microservice] —> [StatsD proxy]  } ——> EXTERNAL HOST{ [StatsD server]}

With our platform, we did not want to couple our infrastructure to the metrics servers. We would prefer the platform to push metrics to an external endpoint and not rely on components running inside our microservice platform. The StatsD proxy would also need to be aware of all the running StatsD servers behind it, therefore scaling is not as simple as increasing a Kubernetes deployment replica value. The proxy would need to be reconfigured to be aware of the new instances as you scale up or down.

Prometheus to the rescue

The core problem with StatsD is that the aggregation happens on the server which you need to scale. Our solution: Move the aggregation to somewhere else. Prometheus is a powerful metrics time series database that allows high performing aggregation. It also uses a “pull” model instead of “push” which means it will reach out to endpoints and scrape metrics, so even at high throughput, it can scrape many endpoints efficiently and does this asynchronously outside of the main request path.

You are probably thinking, “So what happens to StatsD???”

Answer: StatsD-Exporter

The folks at Prometheus have an awesome metrics converter that is lightweight, can be load balanced and deals with the task of receiving StatsD metrics and converts them into Prometheus metrics whilst also allowing Prometheus to scrape them periodically.

This design removes the stress of aggregation at the receiving end so even at high request volume, metrics can flow in at thousands of requests per second whilst being scraped every 5 seconds or so, outside of the main request path.

[Microservice] –>  {Load Balancer} –> [StatsD-exporter]  <– [Prometheus] <– [reporting]

A microservice would send its statistics using StatsD client to a single endpoint which is load balanced. The stat would hit any StatsD-exporter and would be made available for scraping.

Prometheus will scrape the StatsD-exporter and make the metrics available in its time series database for reporting in Grafana.

Running StatsD-exporters as a Kubernetes pod allows you to scale up easily. Prometheus has Kubernetes service discovery built in, so if configured correctly you can allow Prometheus to use the Kubernetes API to find your StatsD-exporter pods and start scraping them almost immediately when they becomes available.

Load testing this solution, we are able to track 30,000 requests per second with a simple F4s series VM in Azure running StatsD-exporter and Prometheus.

From our Azure cloud load testing dashboard we can see our 30 000 requests per second.

These are request counters and timings from the client side :

On the backend we can see Prometheus scraping similar values from StatsD-exporter.The goal is to make sure we see the same numbers on the client and server side, so we do not have any discrepancies between the monitoring and the load testing platform.

From then onwards, we can feed that data through to Grafana for our monitoring dashboards:

Having a scalable metrics platform like above not only allows us to track things in the microservice world, but also saves a lot of costs. StatsD adds very little client overhead as well as minimal friction in the platform’s network. Since we have full control over how much data we want to keep and archive, we can fine tune the cost model. With most third party offerings, the cost of running hundreds of microservices quickly adds up to a couple of thousand dollars per month because there is a flat fee per gigabyte of data.

We hope this article helps you as an engineer make smarter decisions when deciding on using or building a new scalable metrics system.

Monolith to Micro-services | Part 2 | All aboard with Kubernetes

As the paradigm shifts more to container workloads and microservices, Webjet was looking for a way to deploy containers as well as manage them. In part one we dived into the journey of microservices, our traditional Azure Web App architecture and how we started adopting container workloads. We learnt to write systems in golang and dotnet core, how to write Dockerfiles and build up a series of base images. Most importantly we built the foundation of what’s required to build and manage containers effectively.

This era of our container journey plays a big role in how things turned out. When we started looking at container orchestrators, there were only a few and not all of them were production ready. If you read our blogs you should know by now that Microsoft Azure is our “go to” platform, so it is where we started. At the time (late 2016), the most production ready platform was DC/OS . Kubernetes was not released yet and Docker Swarm was in private preview. For us, the orchestrator needed one key feature..

Run my container and keep it running!

The main challenge was building a CI/CD pipeline that would plug into a container orchestrator and have a service discovery mechanism, so we could route traffic from the customer’s browser, to the individual containers, no matter where they were running. We wanted to be platform agnostic, so we could run on any orchestrator. The good things about every orchestrator, is that they generally provide built in service discovery and have a method of defining an “Ingress” (Where network traffic enters) through a public IP address.

Batman’s Operating System

For DC/OS, it was Marathon and NGINX:

It serves the purpose of “Ingress” and has a public IP address. Customer traffic arrives at Marathon, and it can find other containers inside the cluster without having to know private IP addresses. Marathon routes traffic to our own customised Nginx container, which in turn serves as the API gateway. The API gateway routes to the correct container based on its URL path and terminates SSL traffic and sends traffic privately to microservice containers.

Ask Jeeves

To solve the CI/CD piece, we turned to the popular Jenkins build tool. One key feature that Jenkins provide is ability to write pipeline as code .

Writing a declarative pipeline definition as code allowed the team to have version control for their CI/CD pipeline side by side with the code. It also means no one must manually create pipelines with the web user interface. Pipelines can be parameterised and re-used across new microservice implementations. This allows us to move faster when implementing new services and we don’t have to spend time designing the pipeline from scratch.  The Pipeline file defines the CI/CD process and the Dockerfile defines the application and its dependencies. These two files form the ultimate source of truth and allows for a fully automated deployment platform where the source of truth is in the source control repository and not in the snowflake environment.

Once we had these two components in place, CI taking care of the image building and pushing to Azure Container Registry, CD taking care of deployment to DC/OS and Marathon taking care of service discovery, we had a foundation in place to deploy our first production service.

Webjet chose a small, isolated, non-critical piece of functionality which we pulled out of the legacy monolithic stack and containerised. It became the canary that would test out the container CI/CD and orchestration system.

One thing we were not satisfied with, was the lack of secret management in the open source version of DC/OS. This version did not support secret management which at the time was an enterprise-only feature. We wanted to avoid enterprise agreements and vendor lock ins our docker environment. We preferred the ability to lift and shift to various orchestrators when the need arises. Our apps needed to be cloud native, and therefore run anywhere.

Capt’n Kube to the Rescue

Roughly a week into production, Microsoft announced Kubernetes general availability on the Azure Container Service platform (ACS)*. During this time, containers were a new thing on Azure. For us being new to this as well, we were fortunate enough to mature alongside the platform as Kubernetes, which itself was just over 2 years old. We were able to leverage our relationship with Microsoft and worked together with open source teams at Microsoft and share experiences of the journey. Though these close ties we ensured that our roadmap aligned with that of Microsoft and the Kubernetes upstream.

Microsoft alignment with the upstream Kubernetes community and their massive contribution to open source is what got us excited about Kuberenetes. We could finally build a microservice stack on a cloud agnostic and cloud native platform. It can literally run anywhere.

Our next move was to deploy a mirror of what we had on DC/OS, but this time use Kubernetes as the platform. The benefits of our initial CI/CD process were realised, and we seamlessly plugged into the new platform. We replaced Marathon and the Nginx API gateway with Kubernetes Ingress controller. Ingress takes care of service discovery and URL path routing within the cluster. It also runs through a public IP address and operates at the edge of the cluster for receiving inbound customer traffic.

With CI/CD in place we could deploy our non-critical microservice to this cluster and the services were accessible by the customer over the same URL.

The traffic flow looked like this:

[domain.webjet.com.au] —(DNS routing)–> [Azure Load Balancer] —> [Kubernetes Ingress Controller] —(URL routing /api/hotels/upsell)—–> [microservice]

Once tested, all we changed was the endpoint where the domain name was pointing (from the DC/OS IP to the Kubernetes Azure Load balancer IP) and traffic started to flow to the new implementation. We switched over from DC/OS to Kubernetes within a week after we went live. How dope is that?

You’re probably thinking, “how are you monitoring these containers and VMs?”

In Part 3, we will look at logging and monitoring and how Webjet embraced open source tools to simplify the entire monitoring and observability process.

Until next time!

* One thing to note is that ACS was not the managed Kubernetes version (AKS) we know of today

Monolith to Micro-services | Part 1 | An unexpected Docker journey

Micro-services have been a hot topic for us folk at Webjet. Like many other software teams, at Webjet, we have been working over the years with what we would more recently call a monolithic architecture.  Being faced with changing the way we engineer our solutions to meet the scale, agility and momentum our business demands, we turned to micro-services as a solution for delivering new features.   This decision led to an unexpected journey with Docker which we would like to share with the broader community

Where did our journey start, what is a monolith ?

In simple terms, a monolithic application (monolith) is an application where the user interface tier and its data access code are stitched together in a single application on a single platform. As the application grows, more service tiers and application features are introduced and therefore the complexity and configuration of the application and its environment increases. It becomes harder to make even the smallest changes and introducing a breaking change can happen at the blink of an eye. Scaling therefore also becomes a resource-expensive effort, as only whole instances of the entire application can be scaled even though each layer has different load and resources requirements. This leads to over-scaling some layers, but under-scaling others.
So how did we break the shackles of the monolith?
Over time, we started slicing up the monolith into separate services and user interfaces that would become isolated. We would deploy each of these services separately using the Microsoft Azure WebApp platform.

Although this was the first step to a micro-service architecture, we introduced a lot of complexities in our build and continuous integration pipelines. As the number of services grew deployments and setting up CI/CD pipelines took a lot of unnecessary time. We were at a point where we could see that the way we were building and deploying our micro-services would soon hit a bottleneck and slow our journey down.

Where the unexpected journey happened.

Being focused on continually improving our engineering processes, we started a review of how we were deploying our WebApps in our CI/CD pipeline.
WebApps allow you to deploy services on separate servers or to the same pool of servers. Deploying a tiny micro-service to its own server does not sound very efficient. Deploying a few of them sounded like a better option, but what if you have one resource hungry noisy neighbour?

This is where Docker comes in.

Docker is a technology that allows us to build all application code, its operating system, configuration and dependencies into one single entity called a container. For us, it made sense to start building new services on container technology and start the decoupling process of the monolithic application. As a group, we’d have to identify all the components of the monolith that we can break apart, -.e.g flight search, hotel search, shopping carts, up-sell services, autocomplete services, small UI components, etc. , etc. 

For the shift to Docker to happen, we needed a massive technology and mindset shift:, introducing new programming languages, new operating system platforms, new scripting frameworks and many more. 

Docker introduced true immutable applications, the ability to run cross platform and on any cloud. Our Docker solution is also highly scalable and deploys really fast! I can go on and on about the beauties of Docker, but I’ll leave this here if you want to read more on what it is. 

With Docker, we can build layers of images. So as an example, let’s say we use Linux Alpine as a base operating system. Our DevOps team can then build a Webjet certified Linux Alpine image with all the required security patches. This can be used to build a other images that have the dependencies for applications to run, for example, a popular programming language built by Google called GoLang 

We embarked on a mission to start building out our base Docker image library to make it really simple for teams to build micro-services on different languages. If I was a developer and I needed to use GoLang as a language, I can simply build a new Docker image for my application and inherit the Webjet GoLang image. An example hierarchy can look like this:

Now, Webjet development teams can build services top down not worrying about the low level configuration, whilst DevOps and security teams can architect the base images from bottom up to ensure they all stem from the certified base images. This keeps vulnerabilities to a minimum and keep the images lean and small as possible. 

We’ve also utilised Azure Container Registry for hosting our Docker images which makes it easy to start integrating continuous delivery pipelines and deploying micro-services. 

This brings us to Part 2 of this series where we’ll be covering “Container Orchestration” and Kubernetes: How we at Webjet deploy and manage a large number of containers within the Microsoft Azure cloud infrastructure. 

Until next time! 


DevOps Deployment Framework. The rise of dodo

Here at Webjet IT we live and breathe DevOps. Our DevOps journey has been one borne out of automation and a cultural shift in terms of developing and operating production environments.  This first blog will outline our view on automation and how this has help define a framework that has helped improve the cycle times for our pipeline management.

Automation

We strive to automate our software delivery pipeline and ensure our software quality is of the highest standards. Automation is a topic that contributes to the build, deployment and testing pipeline and it involves a lot of scripting. Our pipeline consists of Octopus deployment, mostly PowerShell scripts, Teamcity build and Azure infrastructure.

Most of the time when writing scripts around a process, it’s a process that occurs often… at times too often. For example, our deployment script would look very similar for one product and another. A good example of this could be when a person writes a script to automate deployment of an IIS website, another person would come along a few days later and would want to do the same thing. In this scenario, we’d end up with two implementations of the same solution.  The same applies to software builds, running tests, deployment scripts and many other processes.

Centralised Code Repository for DevOps

Our first approach to solving for duplicating workloads, was to house all these “helper” scripts into a DevOps code repository where IT staff could help themselves to re-use some of the scripts other people have written.

The problem with this solution is isolated scripts cannot really be versioned correctly. Versions cannot be enforced and changes to a centralised scripts can cause breaking changes for others using the same set of scripts.

One perfect example of this was the implementation of our scripts to allow automated deployments of Azure Web Apps. In our DevOps code repository we started writing a set of helper scripts that we could use to interact with the Azure API to deploy Web Apps to Azure cloud. The scripts would allow developers to pass input and expect full deployment and management capabilities of the Azure web app that was being deployed. Our development teams could deploy their apps with single commands, perform configuration updates and slot swaps to make applications active between staging and production slots.

It was a matter of a 2-3 weeks and we were already deploying about 10 web apps to production using the centralized set of scripts

Life was good!

The Azure API is simple to use, but often one line commands are not good enough and defensive coding practices usually end up in many more lines of code that need to be maintained. Centralised framework for these implementations was needed.

DevOps WebApp Deployment Framework was born

We were convinced that what we had was not good enough. Although the scripts were centralised in the DevOps code repository, development teams were still required to physically copy the code out into their build artifacts  so that it can be used. By copying code, you lose versioning.

We created a separate code repository to house the newly formed “DevOps Azure Web App Deployment Framework” and implement tagging as a versioning mechanism.

Development teams would then use Git sub-modules to access the framework, rather than copying the code out. This allows developers to pick the version “tag” of the managed deployment framework that they want to use.

The framework quickly evolved from there and Azure Web-jobs deployment feature was added.

Life got even better!

Development teams were consuming the framework on a number of different Azure web app and web job solutions and it hardly required any bug fixes. Git submodule introduced it own problems and I had to think of a better approach to consuming the framework.

PowerShell modules were exactly what we needed. They are centralised, self contained, versioned and can live on many machines with many different versions on the same machine. PowerShell modules can also be consumed by a single shell instance in memory at runtime which means it does not have to be installed on a machine if you don’t want to install it.

DODO was born!

     ______ __
   {-_-_= '. `'.
    {=_=_-  \   \
     {_-_   |   /
      '-.   |  /    .===,
   .--.__\  |_(_,==`  ( o)'-.
  `---.=_ `     ;      `/    \
      `,-_       ;    .'--') /
        {=_       ;=~`    `"`
         `//__,-=~`
         <<__ \\__
         /`)))/`)))

We needed to call this module something. Give it a code name that be catchy and become popular among the teams at Webjet.

The DevOps Deployment Orchestration  module (DODO) was born.

The latest code from the DevOps Web App Deployment Framework was copied out into a new repository and converted to a PowerShell module.

We decided to simplify the input and make every command of DODO take a JSON object, JSON string or JSON file path. This means the user can simply use a deployment template and pass it to a DODO command which will perform the actions.

Development teams no longer had to use GIT sub-modules and did not require the code inside their repositories. Where ever we have an Octopus deployment tentacle agent, we’d install DODO and development teams can simplify their deployment scripts by calling the one liner commands with JSON input.

Example: Publish-DODOAzureWebApp $parameters

$parameters would be a json object which houses the required parameters to deploy such as Azure subscription ID, web app name etc.

Azure Deployments and Infrastructure deployments

DODO grew very quickly to support most of the Azure infrastructure.

You can spin up an entire environment including Virtual Networks, Web Apps, SQL servers + Databases, Redis Cache, Storage Accounts, Security Groups, Load Balancers, Automation accounts, Run books, Key Vaults, Cloud Services, Virtual Machines and perform DSC operations.

DODO also supports various windows automation features, such as installing IIS, web applications, application pools, Application Request Routing features, rules, probes and server farms.

Future of DODO

We’ve recently created the command line (dodo.exe) version of DODO which is just a C# console application that runs DODO operations.

Because DODO is mainly written in PowerShell, the EXE simply runs a C# PowerShell runspace that imports DODO into a shell and runs commands on top of the JSON files that are passed in.

The beauty about this is development teams no longer needed knowledge of PowerShell and could simply call DODO.EXE from their deployment script.

Example: dodo.exe C:\path\to\deployment\template.json

As we shift more and more software into the cloud, DODO would continue to target all our automation needs. Possibly also focus more on build and testing rather than only deployments.

There are also talks on potentially moving DODO to the open source space – but who knows 🙂

The future is bright 🙂